Upcoming Event
 Free Newsletter

Lowcountry counties seeing boom in investment
Staff Report //August 17, 2018//


Thanks goodness for the Lowcountry … and the Midlands … and the Upstate.
Investment in South Carolina has been booming in recent years, and a study from financial technology company SmartAsset puts some numbers to the trend.
A handful of counties exploded with more than a billion in GDP in 2018. Specifically, the analysis found that Charleston, Greenville, Richland and Horry counties each broke the $1 billion mark, with Charleston County hitting $1.7 billion, the most in the state.
GDP is considered to be a strong economic measure of productivity and economic robustness. Those four counties accounted for $5.7 billion in GDP in the state.
 Delving deeper into the study, SmartAsset ranked Berkeley County as the second-highest in the state for incoming investment. Technically, Lancaster County is No. 1 based on SmartAsset's incoming investment index, but Berkeley County owns nearly every category, sitting at or near the top in growth, GDP and federal funding.
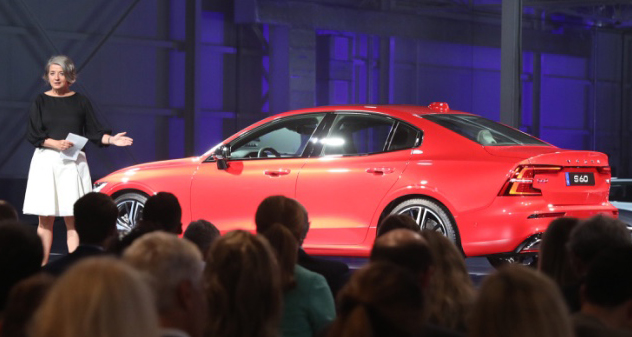
The county has scored some major economic development wins in recent years, the biggest being Volvo Cars. The Chinese-owned, Sweden-based automaker plans to invest $1 billion into hiring 4,000 workers and building two vehicles at its new automotive campus near Ridgeville. Volvo began production this summer on its new S60 sedan.
All three Lowcountry counties rank in the top 10 statewide, and Berkeley County has ranked fourth or higher since at least 2015, the year Volvo made its announcement. Charleston County has been in the top 10 all four years, and Dorchester County was in the top 10 in all but 2016, when it just missed at No. 11.
The study aimed to find the counties with the highest investment from business, real estate, government and the local economy. Factors used in the study included business establishment growth, GDP growth, new building permits and federal funding.
Berkeley County finished 73rd overall nationally, with an incoming investment index of 56.42. Charleston County, at fourth in the state, ranked 83rd nationally, and Dorchester County, eighth statewide, sits at No. 200 nationally.
Investment coming in to S.C. counties
| Rank | County | Business Growth |
GDP Growth (millions) |
New Building Permits1 |
Federal Funding2 |
Incoming Investment Index |
| 1 | Lancaster | 5.6% | $172 | 34.1 | $9 | 67.17 |
| 2 | Berkeley | 6.8% | $378 | 24.2 | $999 | 56.42 |
| 3 | Jasper | 12.5% | $80 | 20.5 | $288 | 56.18 |
| 4 | Charleston | 8.0% | $1,705 | 21.6 | $2,135 | 55.39 |
| 5 | York | 5.2% | $624 | 23.6 | $35 | 54.47 |
| 6 | Horry | 4.1% | $1,130 | 20.5 | $33 | 50.26 |
| 7 | Greenville | 3.9% | $1,670 | 18.3 | $3,583 | 48.26 |
| 8 | Dorchester | 4.4% | $293 | 17.6 | $173 | 46.19 |
| 9 | Beaufort | 4.9% | $666 | 16.0 | $183 | 45.10 |
| 10 | Lexington | 2.3% | $829 | 16.5 | $244 | 43.66 |
| SC | -0.3% | $2983 | 8.9 | $727 |
1.Permits per 1,000 homes
2.Funding per capita
3.$298 million is the average GDP growth for all counties in the state.
Source: SmartAsset.com study: "Places With the Most Incoming Investments"